Operational Intelligence for Stadiums & Event Venues
Stadium and event environments operate with large crowd volumes across seating areas, concourses, restrooms, concessions, and entry gates — where rapid response is essential.
Tapelligence enables real-time detection and coordinated response across high-density environments.
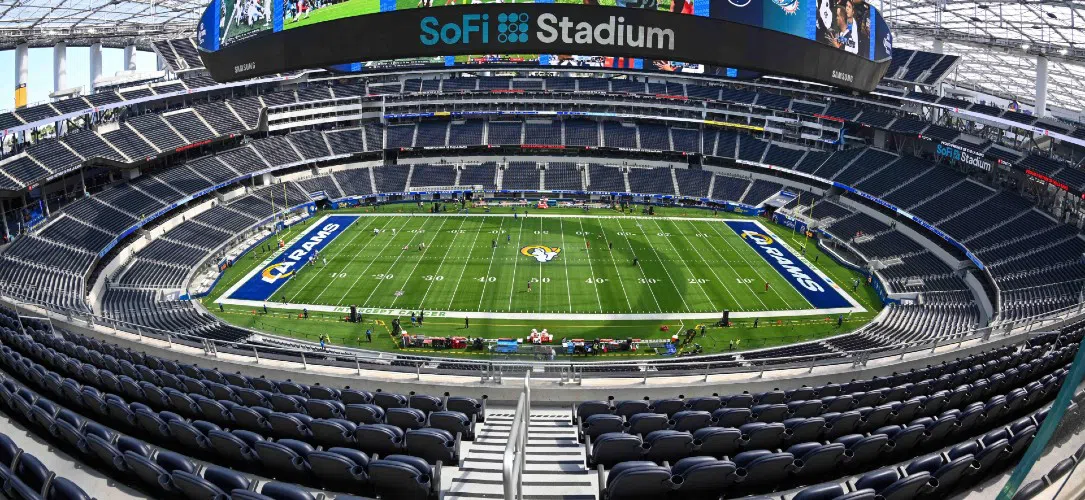
High Density Environments Create Detection Blind Spots
Event venues rely heavily on visual observation and crowd reporting to identify hazards. High crowd density increases the likelihood of delayed detection and response.
High Crowd Density
Large gatherings increase incident frequency and reduce individual visibility of hazards.
Rapid Turnover
Events create temporary surges in operational demand that overwhelm standard response capacity.
Distributed Operations
Multiple zones require coordinated response across facilities, cleaning, security, and guest services.
Markers Create a Real-Time Operational Layer
Tapelligence markers are deployed throughout the venue. Each marker turns a physical location into a real-time operational interaction point.
Deploy Markers
Markers placed in seating areas, concourses, restrooms, and entrances.
Issue Detected
Guests or staff report hazards or service needs using markers.
Alert Routed
Alerts are routed to facilities, cleaning, security, or guest services.
Response & Record
All responses are tracked and documented with timestamps.
Alerts Route to the Right Team, Immediately
Facilities
Infrastructure and environmental issues across the venue.
Cleaning Teams
Spills, sanitation, and restroom maintenance.
Security
Crowd safety and incident response.
Guest Services
Assistance, wayfinding, and guest coordination.
The Same System That Reduces Operational Risk Also Improves Guest Experience
Faster response times reduce disruptions and improve event satisfaction.
In high-density environments, detection speed improves further due to increased reporting density across staff and public interaction points.
What Venue Operators Can Expect
<5 min
Typical detection-to-response
Down from 30–120 minutes (environment-dependent)
~90%
Reduction in exposure window
Environment-dependent
100%
Time-stamped audit trail
Every detection event recorded
Operational Controls
Operational Controls ensure consistent response coordination, compliance visibility, and operational accountability across facilities.
Zone Configuration
Define operational zones and coverage areas to ensure clear responsibility and response ownership.
Escalation Rules
Automatically escalate unresolved incidents based on response time thresholds and severity levels.
Response Tracking
Monitor response times and resolution activity across locations and teams.
Compliance Reporting
Generate structured reports supporting operational compliance and risk management documentation.
Audit Trail Visibility
Maintain a complete record of incident detection, response, and resolution activity.
Operational Capabilities
Tapelligence provides a structured operational intelligence layer that improves detection speed, response coordination, and accountability across complex environments.
Real-Time Detection Visibility
Instant identification of hazards, service needs, and operational issues across facilities.
Automated Alert Routing
Issues are automatically routed to the correct team based on location and issue type.
Response Tracking and Documentation
Every detection and response is time-stamped and recorded for accountability and reporting.
Operational Performance Insights
Facilities gain visibility into incident patterns, response times, and risk trends.
Scalable Deployment
The system can be deployed across single facilities or multi-site portfolios without operational disruption.
Pilot Deployment Program
Organizations can begin with a structured pilot deployment to validate operational impact before full-scale rollout.
Targeted Coverage Area
Deployment across a defined zone, department, or facility section.
Preconfigured Markers
Markers are delivered ready for placement with no on-site configuration required.
Staff Orientation
Brief operational guidance for teams responsible for response.
Performance Monitoring
Measurement of detection speed, response time, and operational improvement.
Implementation Timeline
Site assessment and deployment planning.
Marker placement and activation.
Operational monitoring and performance measurement.
Pilot Outcome
At the conclusion of the pilot period, organizations receive a summary of:
Response time improvements
Incident visibility improvements
Operational risk reduction indicators
Deployment recommendations
Time to Measurable Impact
Organizations typically begin to see measurable operational improvements shortly after deployment.
Early Impact Indicators
Within the first 30 days
- Faster hazard detection and response
- Improved visibility into operational activity
- Reduced response delays
- Better coordination between teams
Stabilization Phase
Within 60 to 90 days
- Consistent response performance
- Reduced recurring incidents
- Improved compliance documentation
- More predictable operational workflows
Long-Term Operational Gains
Within 3 to 6 months
- Sustained reduction in operational risk
- Improved staff efficiency
- Better resource allocation
- Stronger operational accountability
- Improved risk defensibility for insurance and compliance
Ready to Deploy Operational Intelligence?
Structured pilot deployments measure impact before scaled rollout.
Request a Coverage Review