Deployment Sizing Estimator
Estimate how Tapelligence Engine Tags scale across your facilities. Size your deployment based on square footage, zones, and location count.
Risk-Based Deployment Models
How deployment scale and coverage intensity are determined by operational risk analysis — not guesswork.
Deployment Sizing
Tag count and zone coverage are calculated from square footage, entry points, and facility layout — scaled per location.
Risk Coverage
Industry-specific incident benchmarks define minimum and maximum coverage thresholds per risk zone classification.
Exposure Modeling
Financial liability is modeled from incident probability, claim severity, and disruption cost — specific to each vertical.
Deploy Tapelligence in Minutes
Four simple steps to transform your facility into an intelligent operational environment.
Place Smart Tags
Position Engine Tags at key operational points throughout your facility — aisles, service areas, high-traffic zones, and critical infrastructure.
Preconfigured Deployment
Tags arrive preprogrammed and ready for placement by staff. No on-site configuration is required — each tag is pre-assigned to its zone and connected to the cloud platform before delivery.
Monitor from Command Center
Access the Tapelligence Command Center for live visibility into every zone, detection event, and operational metric across your facility.
Instant Intelligence
Within minutes of deployment, your team gains structured operational data — incident patterns, response metrics, and actionable insights.
Example Smart Tag Deployment
Engine Tags are strategically placed across aisles, refrigeration sections, service areas, and operational zones to create a comprehensive incident detection network throughout the entire facility.
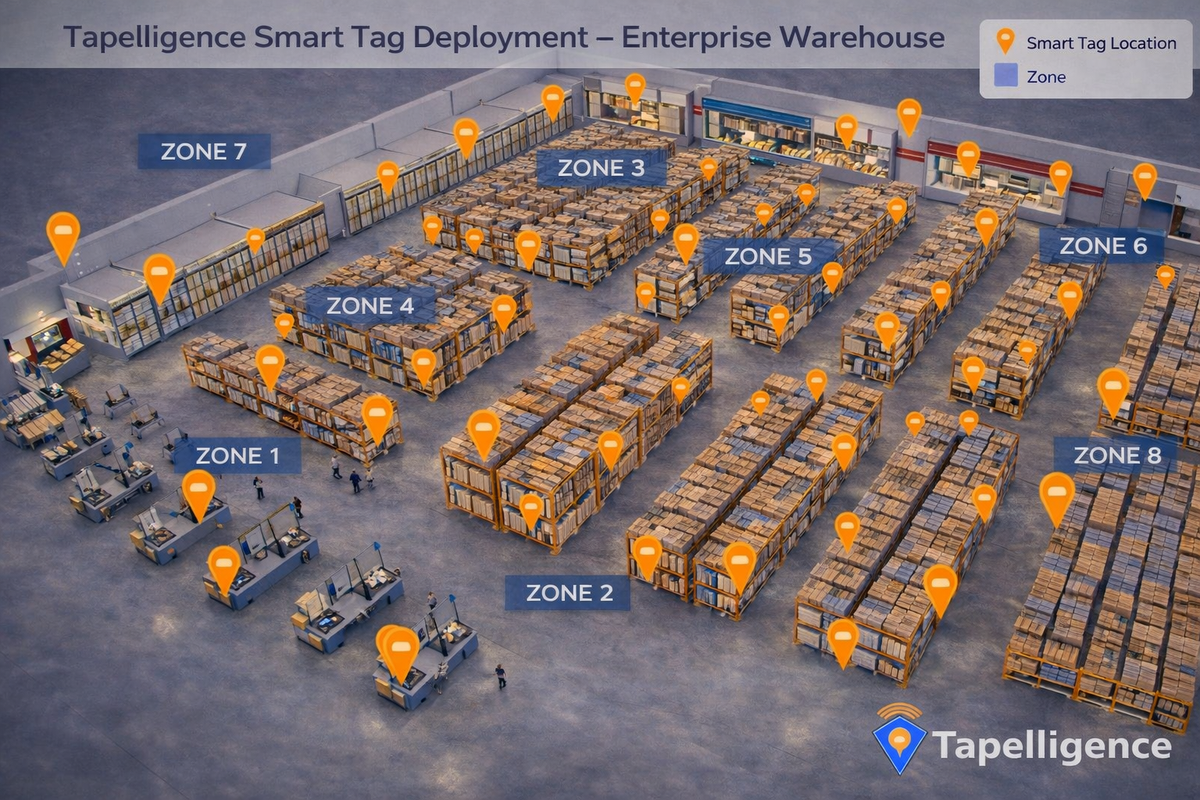
Illustration: Engine Tags strategically deployed across an enterprise warehouse facility, covering aisles, refrigeration, service counters, and high-traffic zones.
Human Presence Becomes Operational Intelligence
High-traffic environments increase both the probability of operational incidents and the number of people present to identify them.
Tapelligence converts this human presence into a distributed operational detection network. As employees move throughout the facility, they become potential detection points capable of identifying hazards, operational disruptions, or safety concerns.
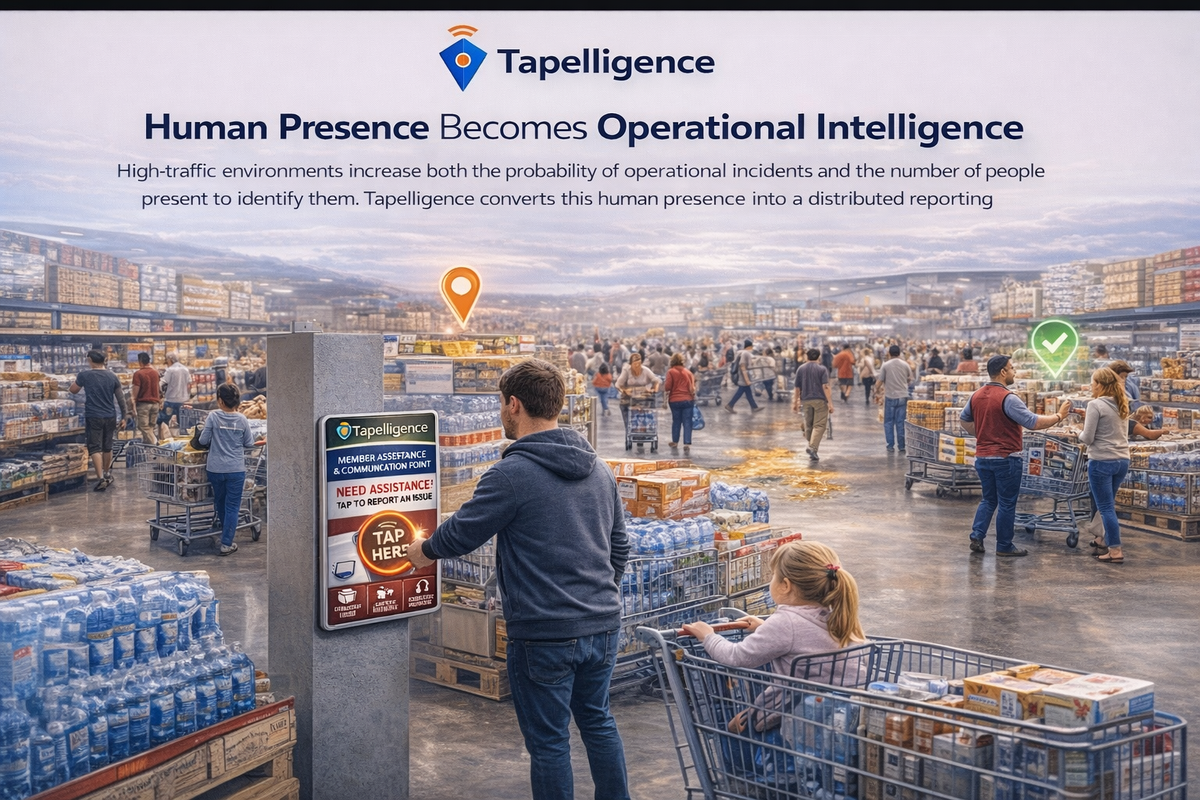
Example Distributed Operational Intelligence Network
Tapelligence connects employees, detection points, and facility operations into a real-time awareness network that scales with activity across the environment.
High Traffic → Greater Awareness → Faster Detection → Faster Response
Tapelligence transforms everyday operational activity into a distributed awareness network across the facility.
Real-Time Hazard Response Across Your Facility
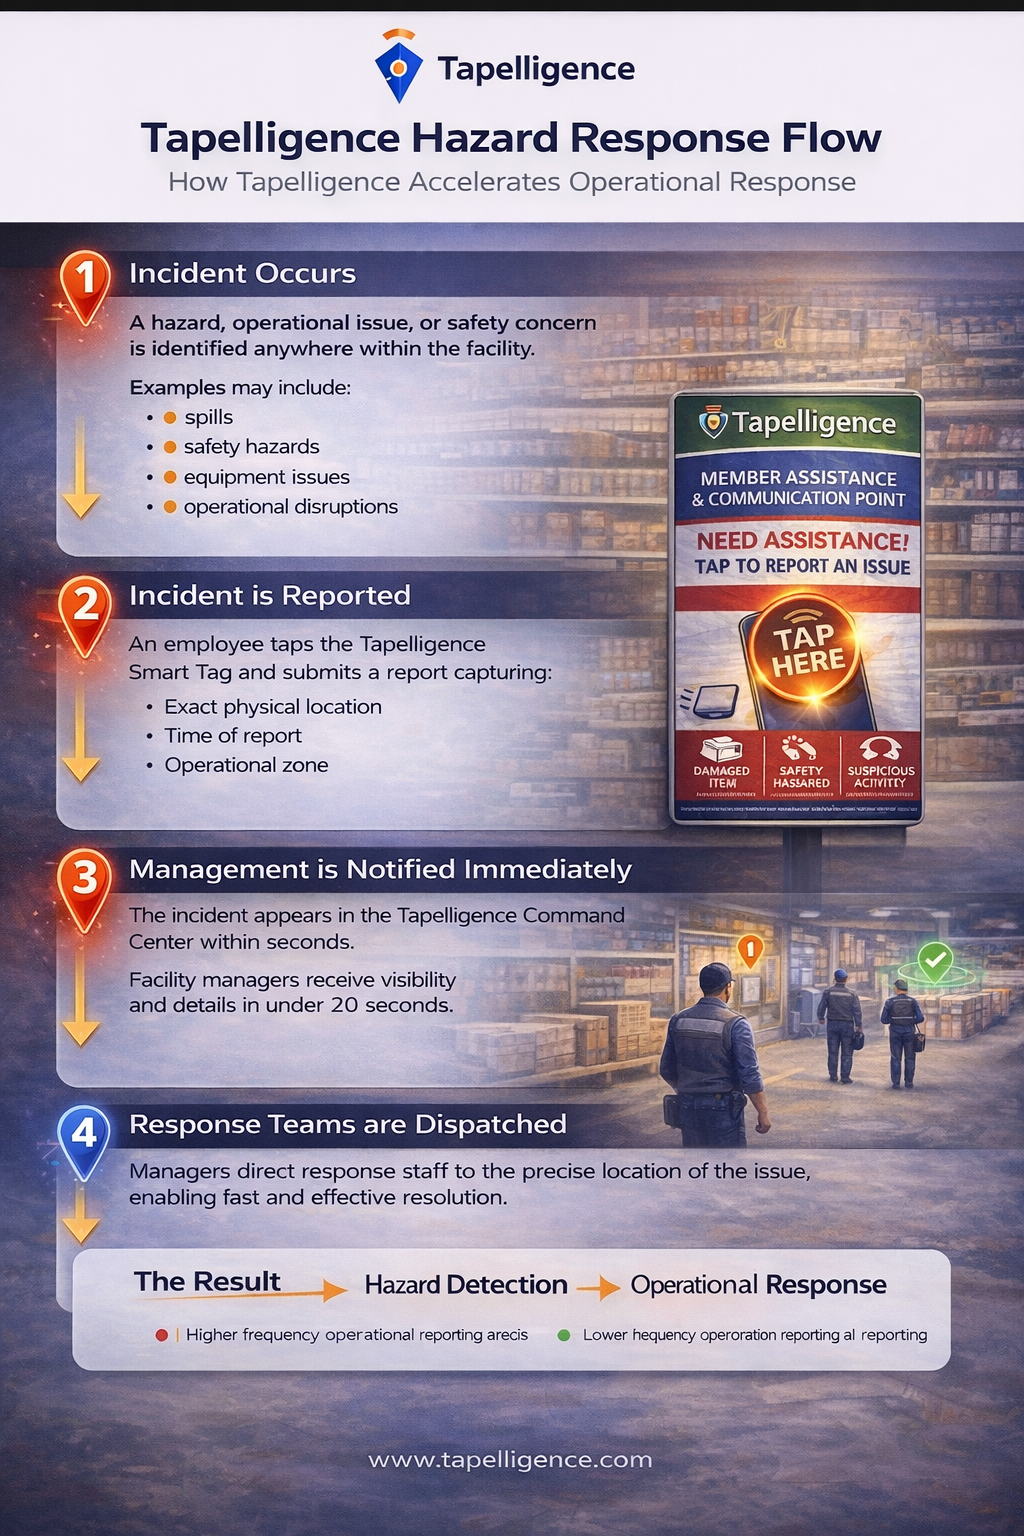
Hazard Detected
An employee identifies an operational hazard — a spill, equipment malfunction, or safety obstruction.
Instant Detection via Tag
The nearest Engine Tag is tapped to trigger a detection event with precise location data.
Command Center Alert
The alert appears instantly with zone location, incident type, and timestamp.
Response & Resolution
Teams are dispatched with full context. Resolution is tracked, logged, and fed into analytics.
Hazard Detection → Operational Response
Operational Visibility Across Your Facility
Once Engine Tags are deployed, Tapelligence captures detection data from throughout the environment.
Over time, these events reveal where activity, incidents, and operational patterns occur across the facility.
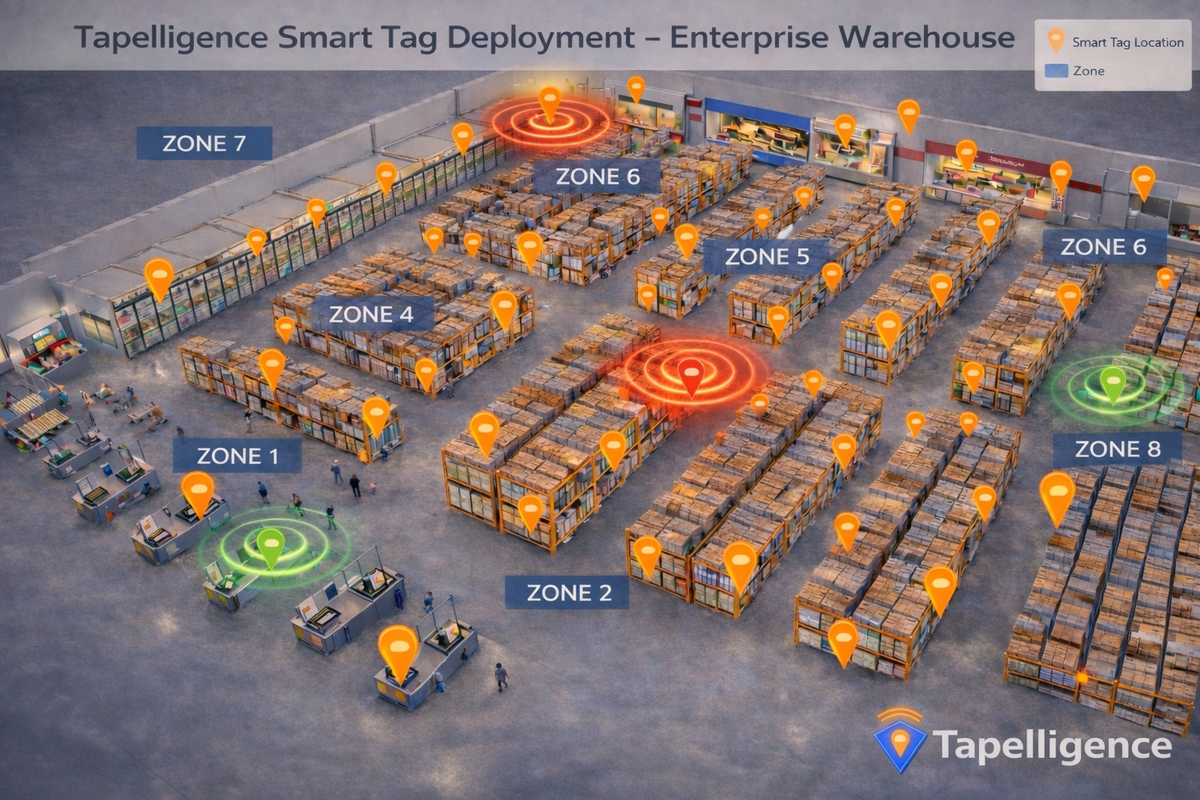
Management teams analyze trends, identify patterns, and make decisions based on real-world detection data.
Structured Operational Intelligence
Engine Tags generate detections from precise physical locations, creating a structured operational dataset over time.
Location-Based Activity Visibility
Reports are automatically associated with their physical location, revealing activity patterns across zones and operational areas.
Data for Operational Decision Making
Organizations use detection data to interpret trends, investigate issues, and guide operational decisions.
Operational Command Center
A centralized dashboard providing real-time visibility into every zone, incident, and operational metric across your entire facility network.
Complete Management Visibility
- Live incident feed with zone-level location precision
- Real-time status tracking for every active alert
- Multi-facility overview for enterprise-wide operations
- Automated alerts and escalation workflows
- Historical trend analysis and pattern detection
- Role-based access for managers, responders, and executives
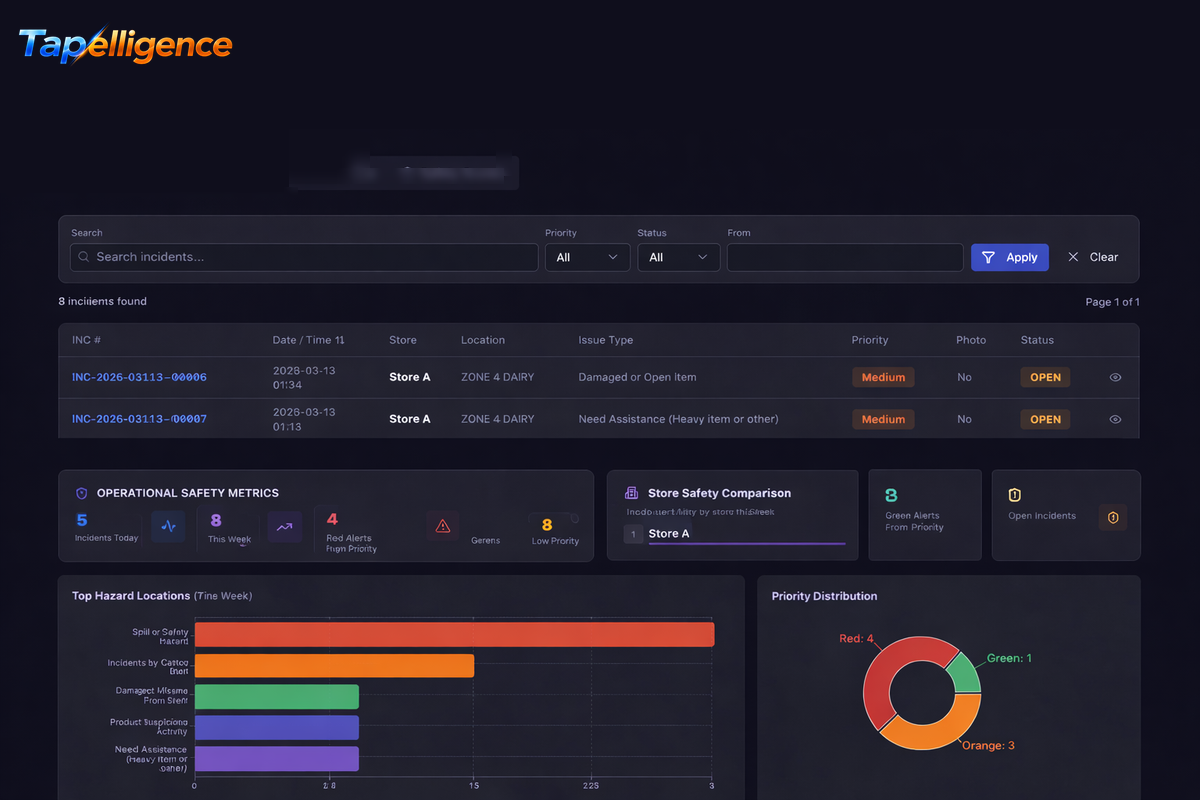
Structured Incident Detection
Transform raw detection events into actionable intelligence with automated categorization, pattern detection, and trend analysis.
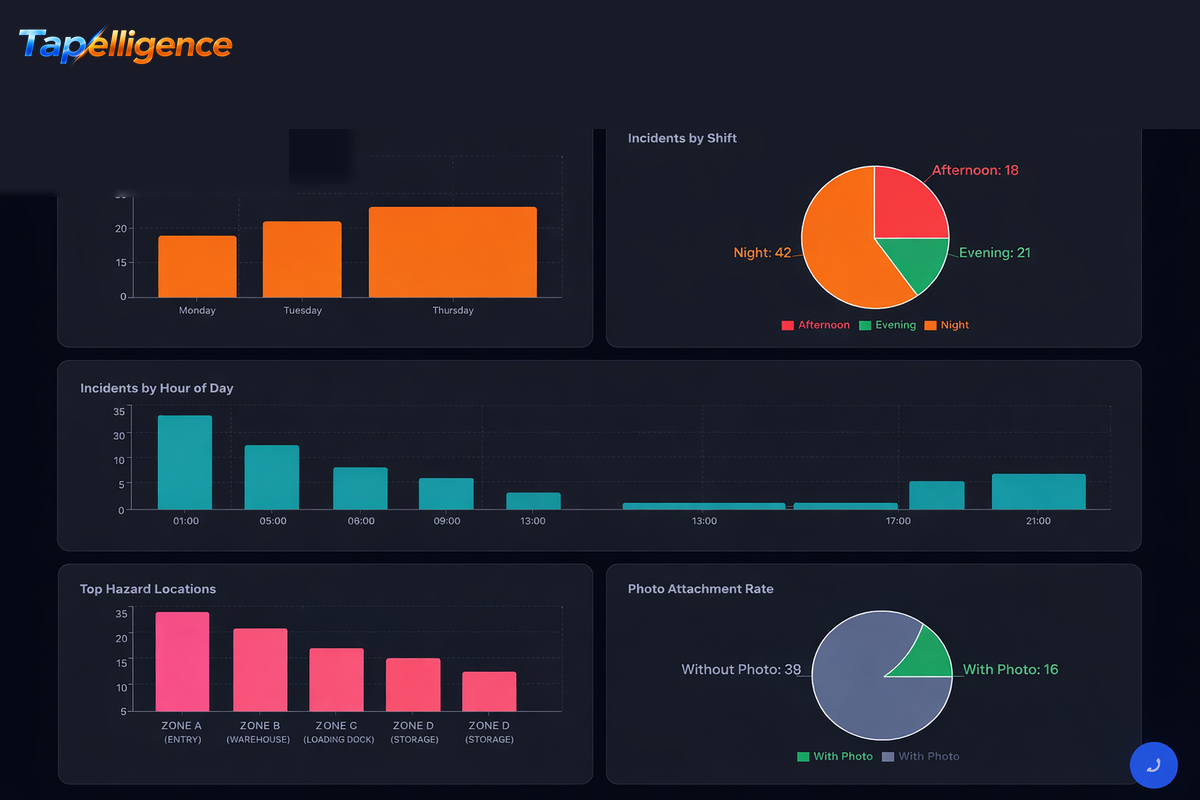
From Detection to Operational Insights
- Automated incident categorization by type, severity, and zone
- Trend analysis revealing recurring operational patterns
- Response time benchmarking across teams and facilities
- Predictive risk scoring based on historical incident data
- Custom intelligence dashboards for compliance and audits
- Export-ready intelligence reports for executive review
See How It Works in Practice
From casino drink requests to hotel towel service — Tapelligence turns everyday interactions into structured operational intelligence.
Explore the Operational ExperienceEstimate Your Deployment
Use this simple estimator to understand how Tapelligence scales across large facilities.
Estimate Your Deployment
Built for Large Multi-Facility Operations
Tapelligence Engine Tags scale across single facilities or global operations. Each location operates as its own detection network while connecting to a centralized enterprise intelligence dashboard.
Facilities Supported
Unlimited multi-location deployments
Tags Per Facility
Flexible deployment based on facility size
Real-Time Detection
Thousands of operational detections per month
Whether operating a single warehouse or hundreds of facilities, Tapelligence creates a unified operational intelligence layer across the entire organization.
A distributed operational intelligence network across your entire facility.
See how Tapelligence would deploy across your facilities.
Plan Your Deployment